
Fig 4. Correlations between oxy-Hb changes over three regions and number of task cycles.
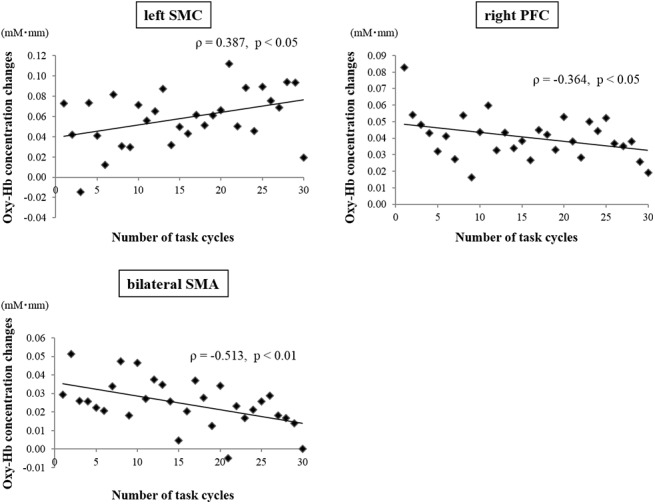
Vertical axis represents mean oxy-Hb concentration changes (in mM*mm). Left SMC activation significantly increased, whereas SMA and right PFC activation significantly decreased with cycle repetition.