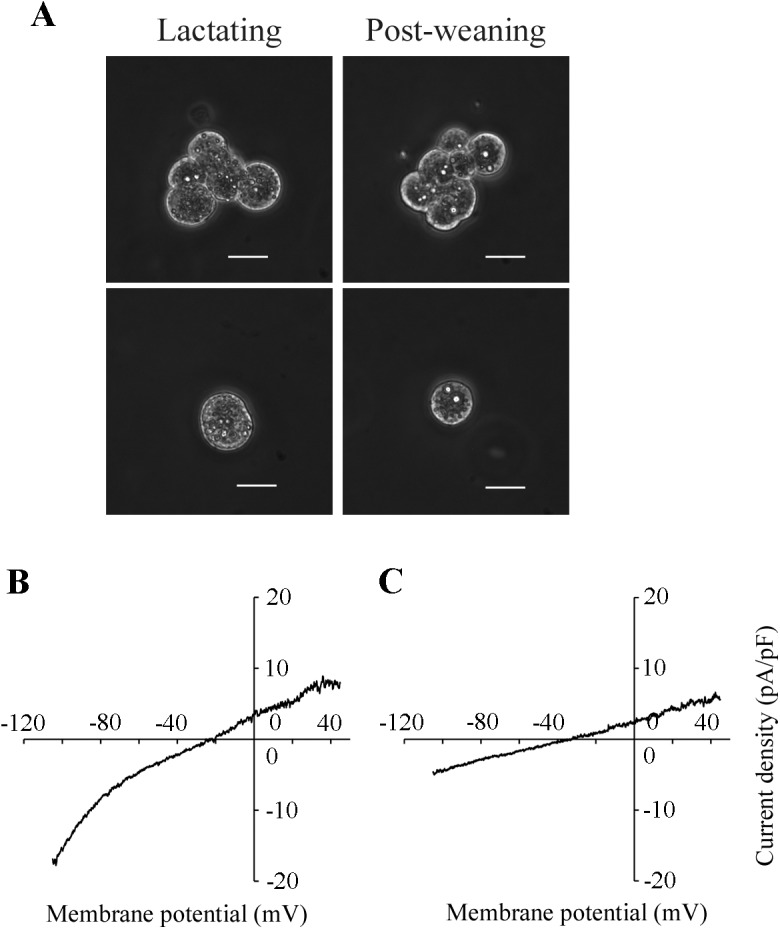
Fig 2. Whole-cell currents in MS cells of lactating and post-weaning mice.

A: representative MS cells. Cell clusters (upper panels) and single cells (lower panels) obtained from lactating and post-weaning mammary glands are shown. Single cells were used for patch-clamp analyses. White bars indicate 20 μm. B, C: representative relationships between whole-cell currents and membrane potentials (I-V) in lactating and post-weaning MS cells. The lactating (B) and post-weaning (C) cells were perfused with the standard pipette solution (K-glutamate-rich solution) and the standard bath solution (NaCl-rich solution). The whole-cell currents were elicited by 800-ms ramp pulses from −105 to +45 mV.
