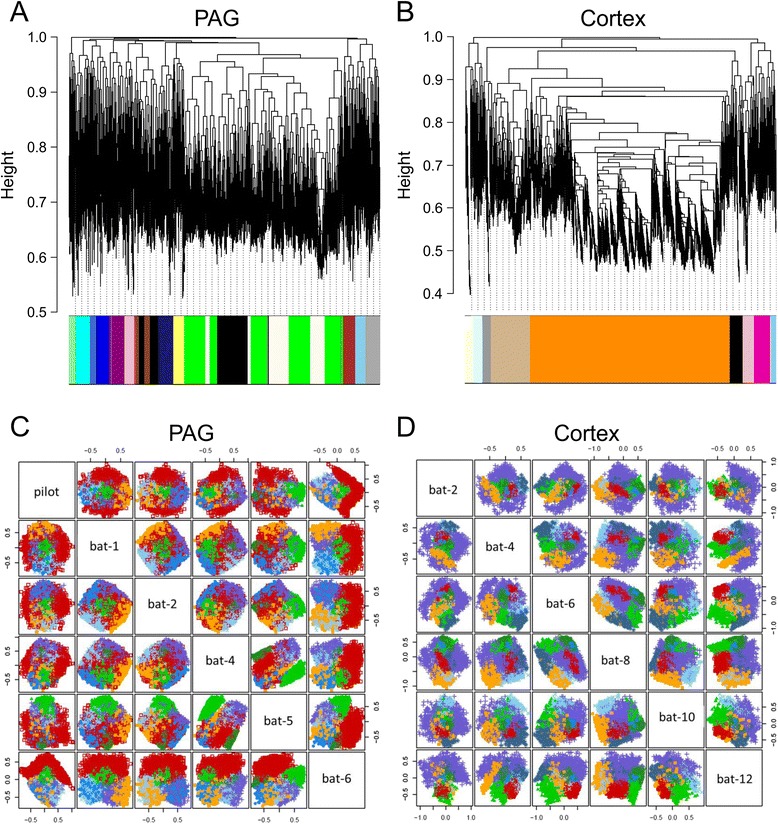
Fig. 2.

Construction of gene co-expression modules via contrasting clustering techniques. (a-b) WGCNA analysis generates dendrograms illustrating hierarchical clustering and modular organisation of the expressed transcripts in (a) the PAG and (b) the cortex. Genes are represented by vertical lines (leaves) on the x-axis grouped into branches, based on topological overlap (TO). Network distance is given on the y-axis (1-TO), and thus the closer the values are to 0, the more closely related the genes. Cluster colour below denotes the separation of leaves into discrete modules. In the PAG 16 modules were identified (part a), and 9 modules were identified in the cortex (part b). Consistent with the high degree of differential expression between these two tissues, the dendrogram and module structure varied greatly across the two tissues. (c-d) Construction of gene co-expression modules via MCLUST. Two dimensional visual representation of the six dimensional construction of the modular organisation of the PAG and cortex. Modules are displayed as groupings of coloured dots, squares or crosses. In the PAG 7 modules were identified (part c), and 8 modules were found in the cortex (part d)
