
Fig. 2.
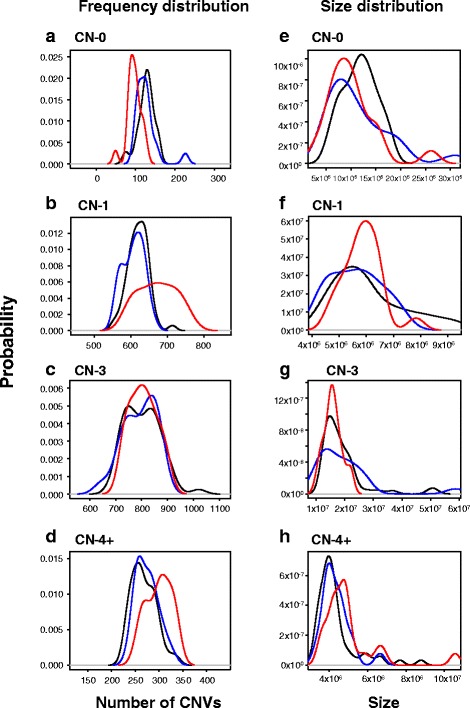
Probability distributions of CNVs by frequency and size in each copy number class in 97 Qataris. Density curves showing the probability (y-axis) of a given individual from each of the 3 subpopulations having a certain number of CNVs (a-d) or a certain cumulative size of the genome affected by CNVs (e-h) in each copy number class (a, e. CN = 0; b, f. CN = 1; c, g. CN = 3; d, h. CN = 4+). All p -values are calculated using the ANOVA-Tukey method. Black trace – Q1, Blue trace - Q2, Red trace – Q3