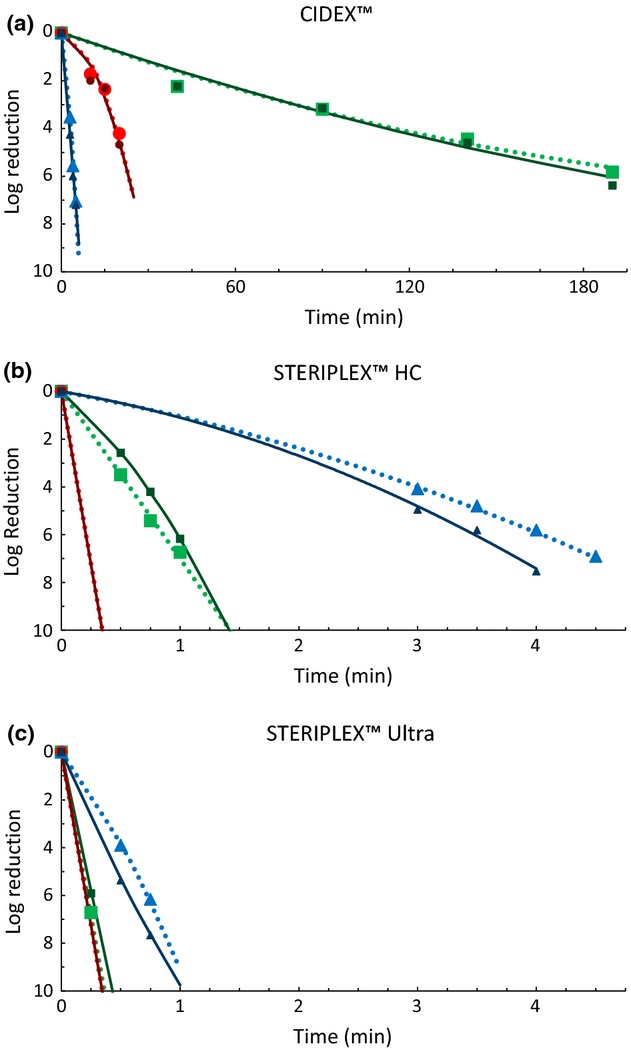
Figure 2.

The inactivation kinetics of spores from Bacillus anthracis ( and
and  ), Bacillus subtilis (
 and
and  ), and Clostridium sporogenes (
 and
and  ) upon treatment with CIDEX™, STERIPLEX™ HC, and STERIPLEX™ Ultra. The bright shapes and dotted lines (
 ) represent the observed values and fitted curves for spores not heat-shocked. The dark shapes and solid lines (
 ) represent the observed values and fitted curves for heat-shocked spores.
