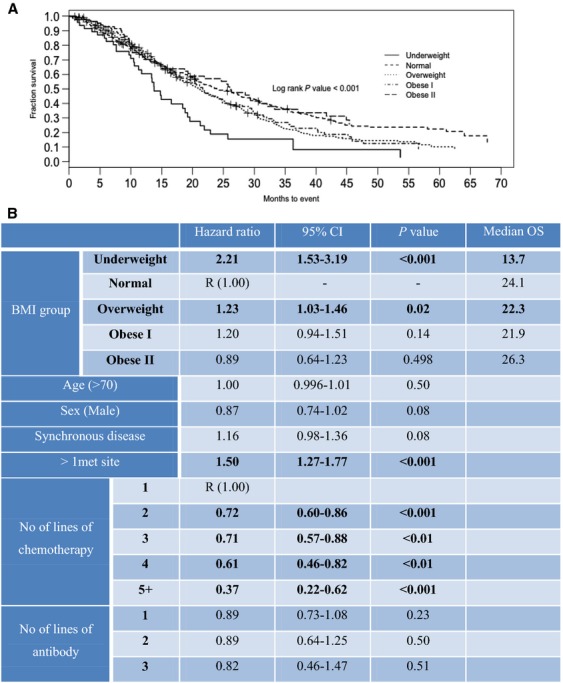
Figure 1.

Kaplan–Meier survival curves (A) and multivariate Cox proportional hazard model (hazard ratio [HR] and and 95% CI) for overall survival by BMI for the whole population (B). Model was adjusted by potential confounders: age, sex, synchronous disease, >1 met site, number of lines of chemotherapy and number of lines of antibody.
