
Figure 2.
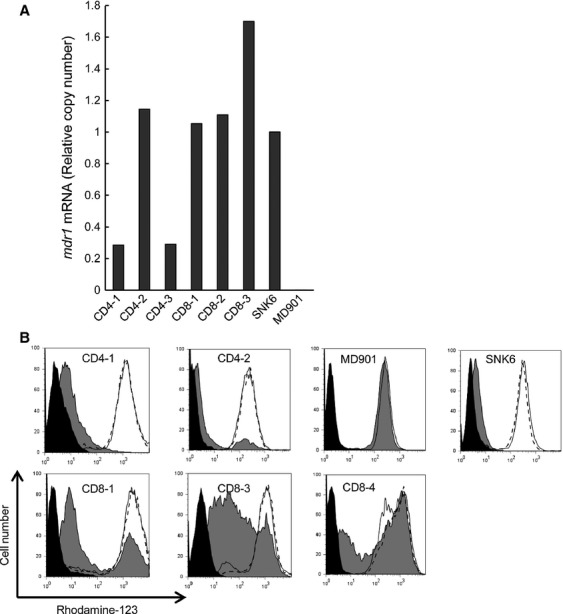
mdr1 RNA expression in EBV-T-LPDs patient cells. (A) mdr1 RNA expression in EBV-positive cell fractions of EBV-T-LPDs patients was examined by quantitative RT-PCR assay. Transcripts of mdr1 and GAPDH of each patient were quantitated by real-time RT-PCR. SNK6 and MD901 were examined as a positive and negative control, respectively. Relative copy number was obtained by normalizing the mdr1 transcripts to those of GAPDH. (B) Function of P-gp was examined by Rhodamine-123 efflux assay in EBV-positive cells of EBV-T-LPDs patients. Cells were incubated with 500 ng/mL of Rhodamine-123 for 30 min at 37°C, then allowed to efflux the dye in dye-free 10% FCS-RPMI for 2 h at 37°C (gray, shaded histogram) or at 4°C (open histogram). The assay was also performed at 37°C with 2 μmol/L of CsA, a potent inhibitor of P-gp (open histogram with dot line). After efflux, cells were analyzed using flow cytometer. The untreated cells were presented in black, shaded histogram. EBV-T-LPDs, Epstein–Barr virus-positive T-cell lymphoproliferative diseases; RT-PCR, reverse-transcriptase polymerase chain reaction; GAPDH, glyceraldehyde-3-phosphate dehydrogenase; P-gp, P-glycoprotein; FCS, fetal calf serum; CsA, cyclosporine A.