
Figure 4.
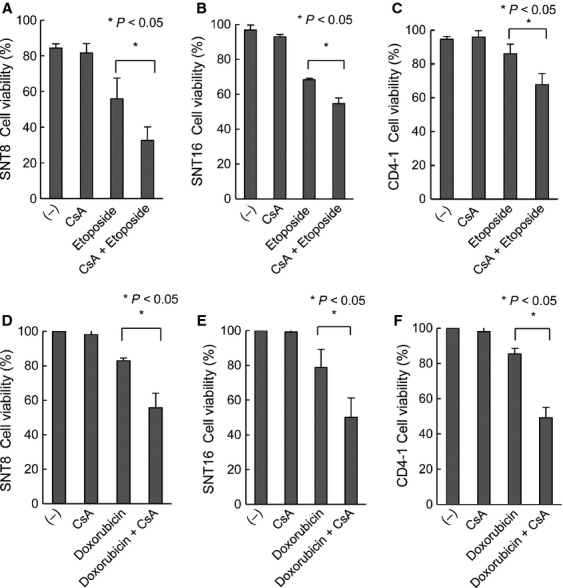
The effects of P-glycoprotein inhibitor, cyclosporine A, on etoposide- and doxorubicin-induced cell death in EBV-T-LPDs cells. (A and B) EBV-T-LPDs cell lines, SNT8 (A) and SNT16 (B) were cultured with 2 μmol/L of cyclosporine A with or without 2 μmol/L of etoposide as indicated for 24 h. Cell viability of each cell line was examined by trypan blue staining. The graph chart represents the mean ± SD of three independent experiments. (C) PBMCs from EBV-T-LPDs patients (case CD4-1) were cultured in 10% FCS–RPMI containing IL-2 with 1 μmol/L of cyclosporine A with or without 0.5 μmol/L of VP16 as indicated for 24 h. Cell viability was examined by trypan blue staining. The graph chart represents the mean ± SD of three independent experiments. (D and E) EBV-T-LPDs cell lines, SNT8 (D) and SNT16 (E) were cultured with 2 μmol/L of cyclosporine A with or without 10 nmol/L of doxorubicin as indicated for 24 h. Cell viability was examined by trypan blue staining. The graph chart represents the mean ± SD of three independent experiments. (F) PBMCs from EBV-T-LPDs patients (case CD4-1) were cultured in 10% FCS–RPMI containing IL-2 with 1 μmol/L of cyclosporine A with or without 10 nmol/L of doxorubicin as indicated for 24 h. Cell viability was examined by trypan blue staining. The graph chart represents the mean ± SD of three independent experiments. EBV-T-LPDs, Epstein–Barr virus-positive T-cell lymphoproliferative diseases; PBMCs, peripheral blood mononuclear cells; FCS, fetal calf serum; IL-2, interleukin-2.