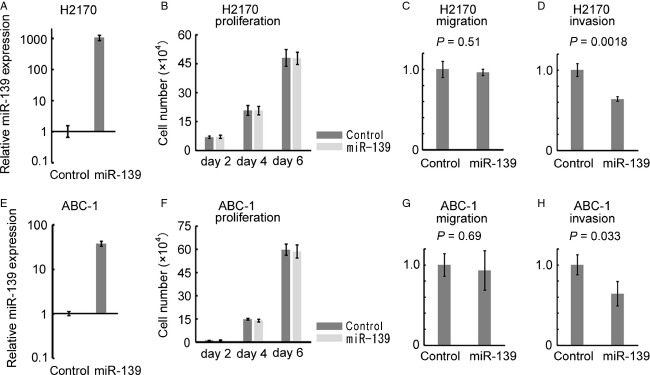
Figure 5.

Overexpression of miR-139 in NCI-H2170 and ABC-1. (A and E) Stable overexpression of miR-139 in NCI-H2170 and ABC-1 cells. The vertical axis indicates miR-139 expression relative to the control vector. The data are shown as mean ± SD (n = 3). (B and F) Cell proliferation of NCI-H2170 and ABC-1 cells overexpressing miR-139. NCI-H2170 and ABC-1 cells were seeded at a density of 5 and 2 × 10⁴ cells per well in a 6-well plate on day 0, and triplicate wells were counted every other day. The data are shown as mean ± SD (n = 3). (C and G) Transwell migration assay of NCI-H2170 and ABC-1 cells overexpressing miR-139. The data are shown as mean ± SD (n = 3) and compared using Student's t-test. (D and H) Transwell invasion assay of NCI-H2170 and ABC-1 cells overexpressing miR-139. The data are shown as mean ± SD (n = 3) and compared using Student's t-test.
