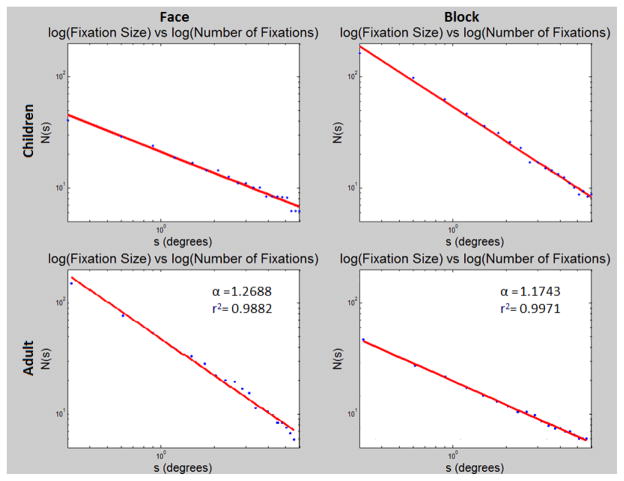
Figure 4.
Representative example of a single trial. Log-log plot showing scaling between fixation size and fixation numbers. Top: Children data. Bottom: Adult data. Left: Faces trials. Right: Blocks trials. Note the stair-casing on the top left plot is due to discretization (i.e. low counts at high spatial scales.

