
Figure 3.
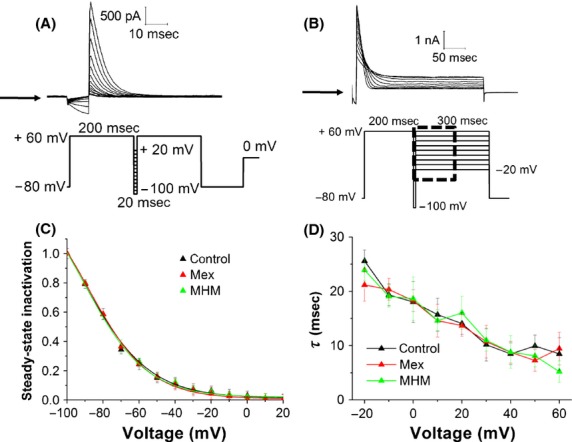
(A) Representative hERG current traces elicited by the voltage protocol shown in the lower panel, testing steady-state inactivation currents. The arrow indicates zero current level. (B) Representative onset of inactivation currents, elicited by a test pulse from +60 mV, to potentials ranging from −20 to +60 mV, in 10 mV-increments. The arrow indicates zero current level. (C) Normalized steady-state I–V inactivation curves before (control) and after application of 10 μmol/L mexiletine and MHM. Data are expressed as mean ± SEM; error bars for some points are masked by symbols (n ≥ 5 per data point). Solid lines represent fits with Boltzmann function. The V1/2 obtained are −90.6 ± 4.7 mV (control), −90.4 ± 2.1 mV (mexiletine), −89.1 ± 3.5 mV (MHM). (D) Inactivation time constants were derived from currents acquired using the protocol shown in (B), fitted with a single exponential function and plotted against the membrane potential. Data are expressed as mean ± SEM (n ≥ 5 per data point).