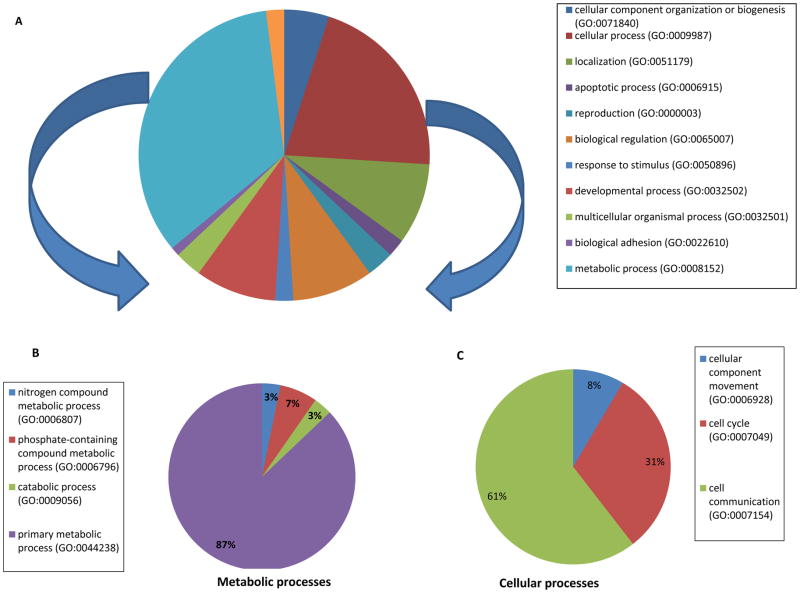
Figure 1. Classification of DEGs among morbidly obese diabetes into biological functions.
A. Pie chart represents all biological functions represented by the 68 DEGs; metabolic and cellular processes denote the 2 biological classes the most represented.
B. Pie chart represents a breakdown of the metabolic processes shown in Figure 1A
C. Pie chart represents a breakdown of the cellular processes shown in Figure 1A

