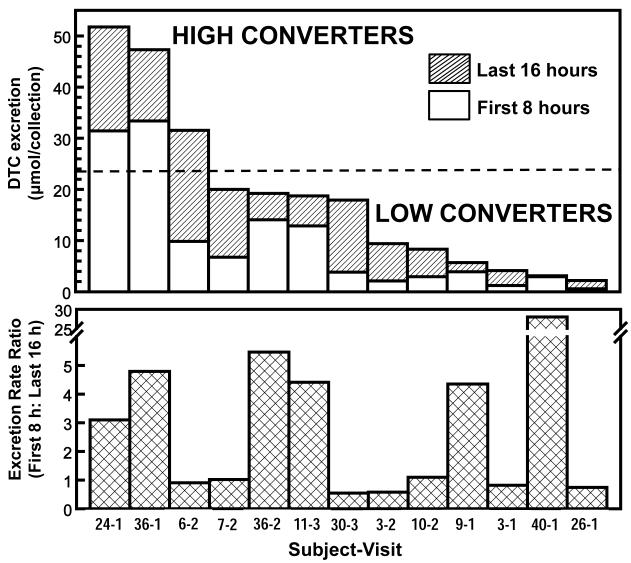
Figure 2.
Time-course of conversion of GR to DTC in a random selection of 13 observations representing both high and low converters. Each subject received a single dose of BSE containing 200 μmol of GR at 8 a.m. each morning. Urine was collected for the first 8 and the subsequent 16 h after dosing. The upper panel shows the total quantity of DTC excreted (range 2.2 - 52 μmol, or from 1 to 26% of dose). The dotted line represents the overall mean for 131 conversion observations (selected from Fig. 1A). The lower panel shows the ratio of the DTC excretions in the first 8 h to the last 16 h. Note that there are High/Fast, High/Slow, Low/Fast, and Low/Slow converter phenotypes (subjects 36-1, 6-2, 40-1, and 3-1, respectively). The horizontal axis designates the number of the subject and which test in a sequence is shown (i.e., 36-2 is the second test in Subject 36).

