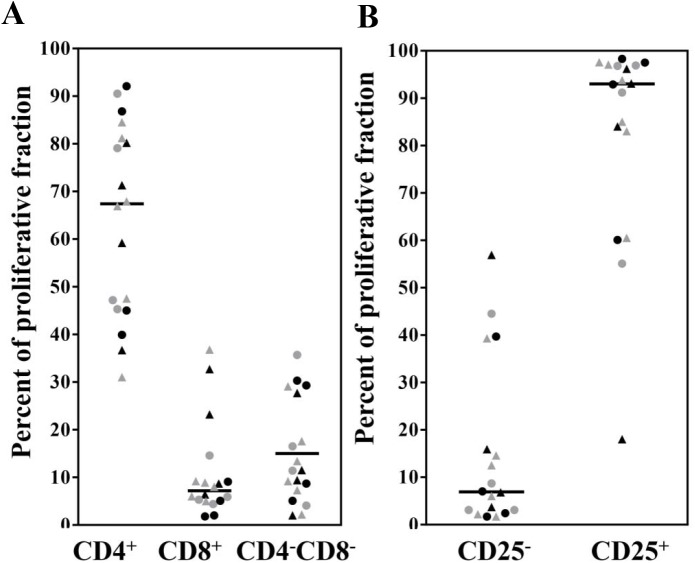
Fig 3. Identification of responding populations by CFDA-SE labeling and flow cytometry analysis.
Identification of proliferating lymphocytes based on expression of (A) CD4 and CD8 or (B) CD25. Circles represent SSG subjects and triangles represent TM subjects. Black and grey are for PRE and POST respectively. Bars represent medians.

