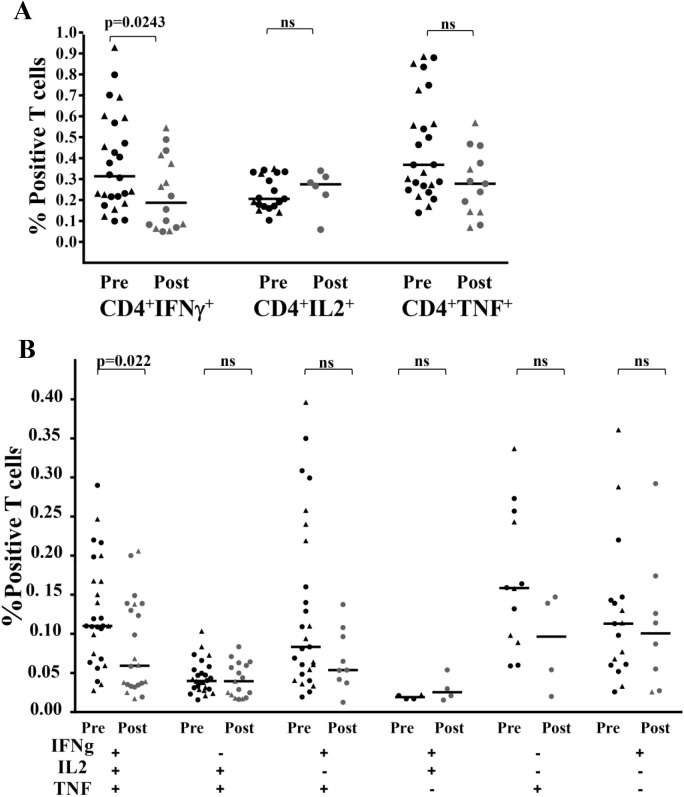
Fig 5. Characterization of the cytokine production capacity of responding T cells.
Multiparameter flow cytometry was used to determine (A) IFN-γ, IL-2, and TNF-α production in CD4+ T cells (B) the frequency of cells expressing each of the seven possible combinations of IFN-γ, IL-2, and TNF-α. Circles represent SSG subjects and triangles represent TM subjects. P values derived using the Mann-Whitney test for unpaired samples.

