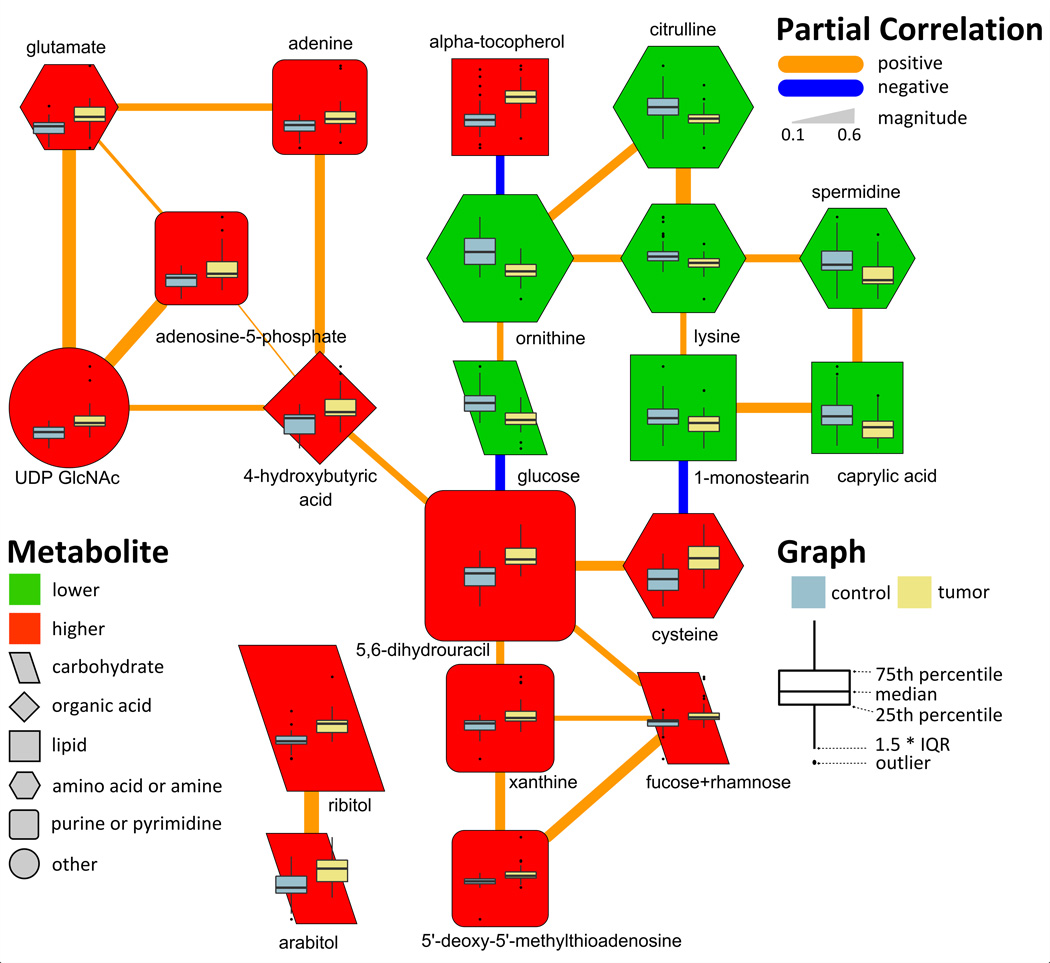
Figure 2.
Partial correlation network displaying conditionally independent relationships between O-PLS-DA selected discriminants for adenocarcinoma (Table 2). Edge color and width denote the direction and magnitude of partial correlations (pFDR≤0.05). Node color displays the direction of the change in tumor relative to non-malignant tissue (green, decrease; red, increase; pFDR ≤ 0.05). Node size displays the metabolite loading (empirical importance) in the O-PLS-DA model and shape denotes the biochemical super class of each molecule. See metabolite O-PLS-DA model loading in Table S4 for quantitative differences in metabolites and corresponding node sizes. Node inset boxplots summarize differences in z-scaled measurements between tumor and non-malignant tissue.

