
Figure 4.
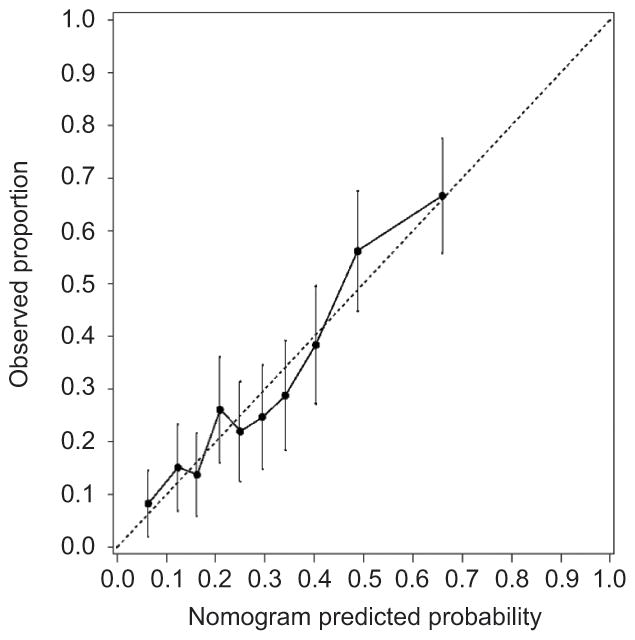
Calibration plot for the final multivariable model depicted in the nomogram. The dashed line indicates the ideal reference line where the predicted probabilities estimated from the model would match the observed proportion that underwent cesarean delivery after induction of labor. Patients were grouped into deciles according to their predicted probability estimated by the final model and the mean predicted probability within each decile is depicted along the x-axis. Within each decile, the observed proportion that underwent cesarean delivery after induction of labor was determined and is depicted along the y-axis along with corresponding 95% confidence intervals (vertical bars).