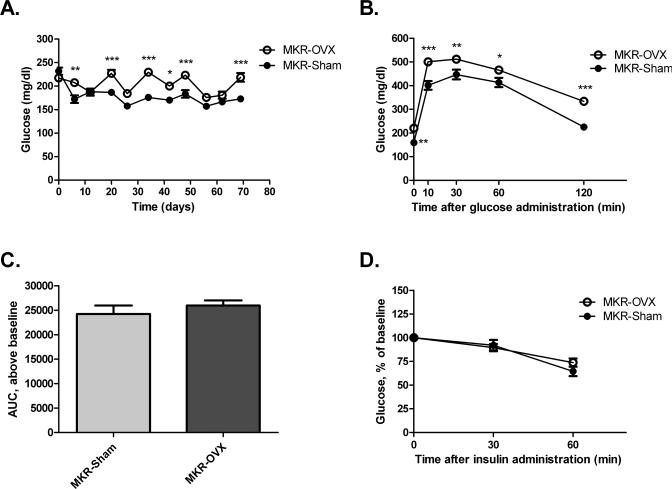
Fig 2. Ovariectomy leads to increased blood glucose levels under fasting and non-fasting conditions.
(A) Blood glucose levels under non-fasting conditions were followed on a weekly basis from before surgery (day 0) until sacrifice. (B) GTT: glucose (2g/kg) was administered I.P. to fasting mice, and blood glucose was measured at the indicated times. (C) Area under the curve for each group was calculated above the respective baseline using GraphPad Prism software. (D) ITT: insulin (12 IU/kg) was administered I.P. to fasting mice, and blood glucose was measured at the indicated times. Results are representatives of Three independent experiments and presented as mean ± SEM, n=10. Two-way ANOVA, followed by Bonferroni multiple comparison post-test (A,B,D), or student's T-test (C) were used to determine the statistical significance; *P<0.05, **P<0.01, ***P<0.001 vs. MKR-Sham.

