
Figure 5. 1,25(OH)2D3 induces CYP27A1 in a VDR-dependent JNK/SAPK signal manner.
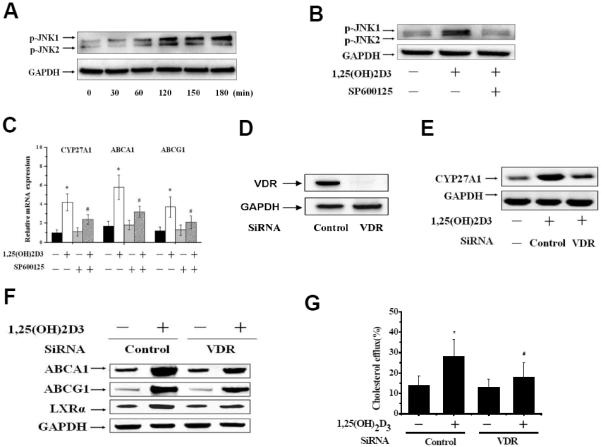
Fig. 5A: THP-1 macrophage-derived foam cells were cultured with either 1,25(OH)2D3 (10nM) or vehicle at the indicated time point. Cells were harvested and subjected to Western blot analysis to monitor the levels of p-JNK1/2. Fig. 5B: THP-1 macrophages were treated with 1,25(OH)2D3 (10nM) or JNK inhibitor SP600125 (2μM) for 3h. Total proteins were subjected to immunoblot analyses with antibody against p-JNK1/2. Fig. 5C: THP-1 macrophage-derived foam cells were treated with SP600125 (2μM) for 30 min, followed by stimulation with 1,25(OH)2D3 (10nM) for 24 h. Total RNA were subjected to real-time PCR for CYP27A1, ABCA1 and ABCG1(*p<0.01 compared to untreated groups, #p<0.01 compared to 1,25(OH)2D3 groups,. Fig. 5D: THP-1 macrophage-derived foam cells were transfected with control or VDR siRNA for 48h, protein samples were immunoblotted with anti-VDR antibody. Fig. 5E: THP-1 macrophage-derived foam cells transfected with control (WT) or VDR siRNA (VDR−/−) were treated with 1,25(OH)2D3 for 24h. CYP27A1 was analyzed by Western-blot. Fig. 5F: ABCA1, ABCG1, and LXR-α expression were analyzed by Western-Blot; Fig. 5G: The intercellular cholesterol efflux was determined by liquid scintillation counting. *p<0.01 compared to other groups. The data represent the mean ± SE from three separate experiments with triplicate samples.