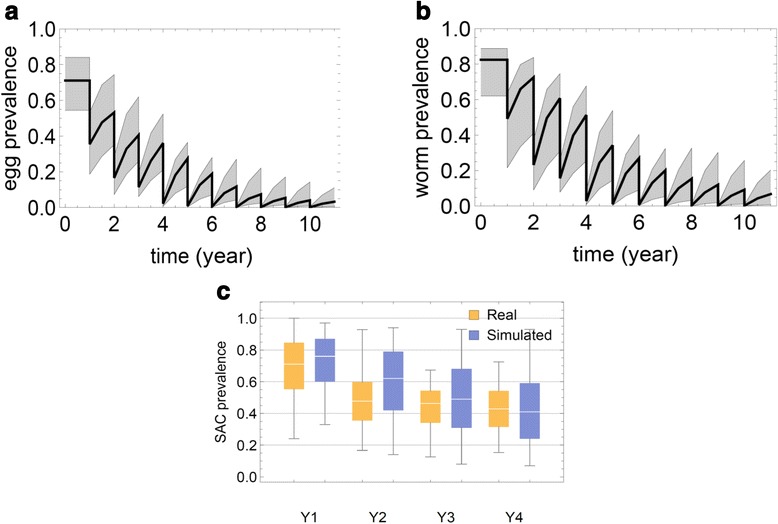
Fig. 6.

Egg prevalence projected in a 10 year MDA treatment simulation. Panel a shows the ensemble of estimated egg count-based prevalence values for 20 virtual communities throughout a 10 year treatment period of annual community-wide MDA. The median prevalence estimate is shown by the thick line, and the 25–75 % quantiles are indicated by the gray envelope; Panel b shows the corresponding estimates of worm-based prevalence, adjusting for the insensitivity and random components of egg counting; Panel c purple bars show the likely range of prevalence values for 9–12 year olds in 25 simulated villages in surveys performed before each of 4 yearly treatments (purple) in a SCORE-like program. Comparison to actual observed data from the SCORE Mozambique project is shown in yellow
