
Fig. 7.
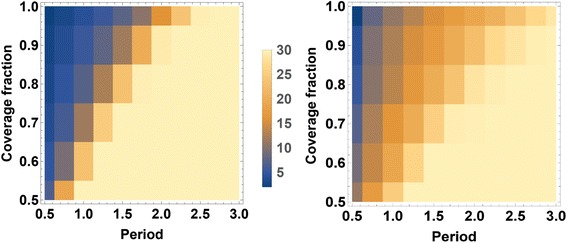
Heat map of the long term program duration (mean T ) required to reach ≤ 2 % Schistosoma prevalence. Two control strategies (CWT and SBT) are compared for typical Kenyan villages. Panel (a) show T(f C, τ) map for a high-risk (80 % baseline prevalence) treated with CWT; (b) lower risk village (30 % baseline prevalence) treated with SBT. The color scale in the center indicates the number of years needed to reach local Schistosoma infection prevalence of ≤ 2 %, as determined by egg-count diagnostics. The darkest color indicates the target will be reached in 5 years or fewer, the lightest color indicates the target is not reached in 30+ years of intervention. In both cases, long term simulations take into account predicted population growth for Kenya [34]