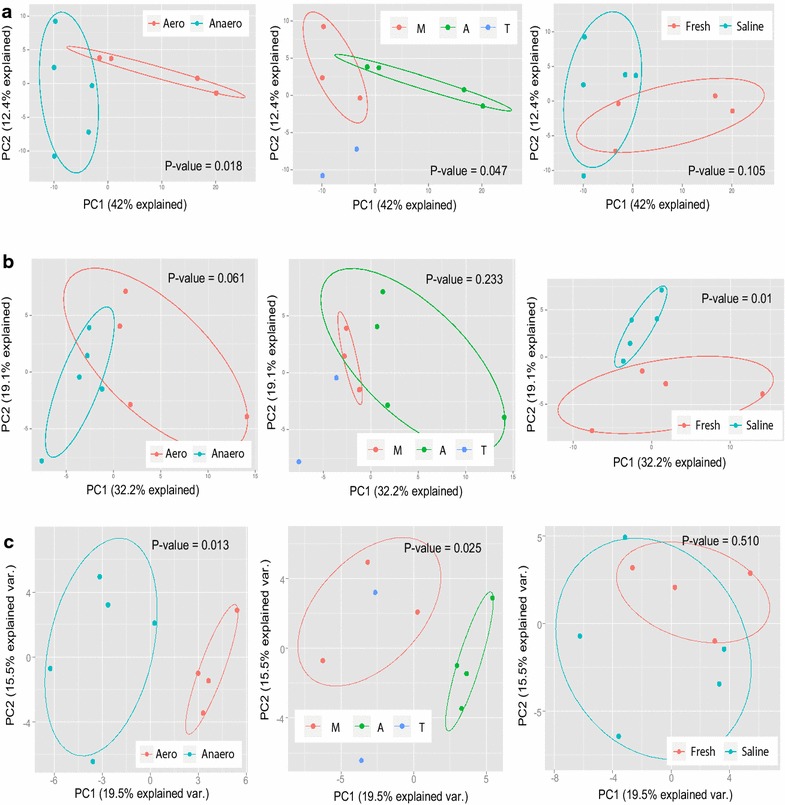
Fig. 1.

Principal coordinate analysis (PCoA) plots depict Bray–Curtis distance between sludge samples using CAG content (a) and phylogeny distribution based on 16S rRNA genes (b) or based on CAG-encoding ORFs (c). Significance Bray–Curtis distance between groups is indicated by p value (analysis of similarity, ANOSIM). Eclipse is drawn with confidence limit of 0.68. Samples are, respectively, colored according to environmental categories of DO (anaerobic and aerobic), temperature (M mesophilic; A ambient temperature; T thermophilic) and salinity (saline and fresh) in the left, middle and right subfigures
