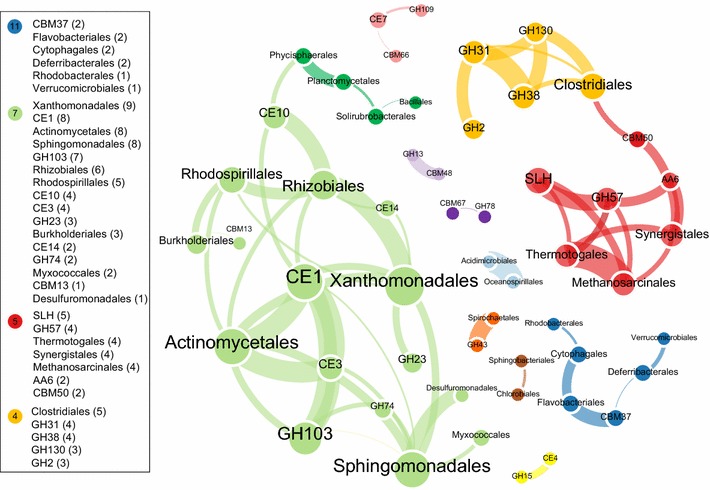
Fig. 3.

Co-occurrence network (that is the positive network) among 46 major CAG families and 40 prevalent phylogenetic orders. Nodes representing either CAG families or phylogenetic orders, were colored according to the network modules (that is clusters) determined by multi-level aggregation method (Louvain algorithm), while edge indicating a strong (Spearman’s rank correlation coefficient r 2 > 0.6) and significant (p value <0.01) positive correlation between node pairs, is in the same color with its source node. The size of each node and the font size of label is proportion to the number of connections (that is degree) of that node. And the thickness of edge is proportion to the correlation coefficient between nodes
