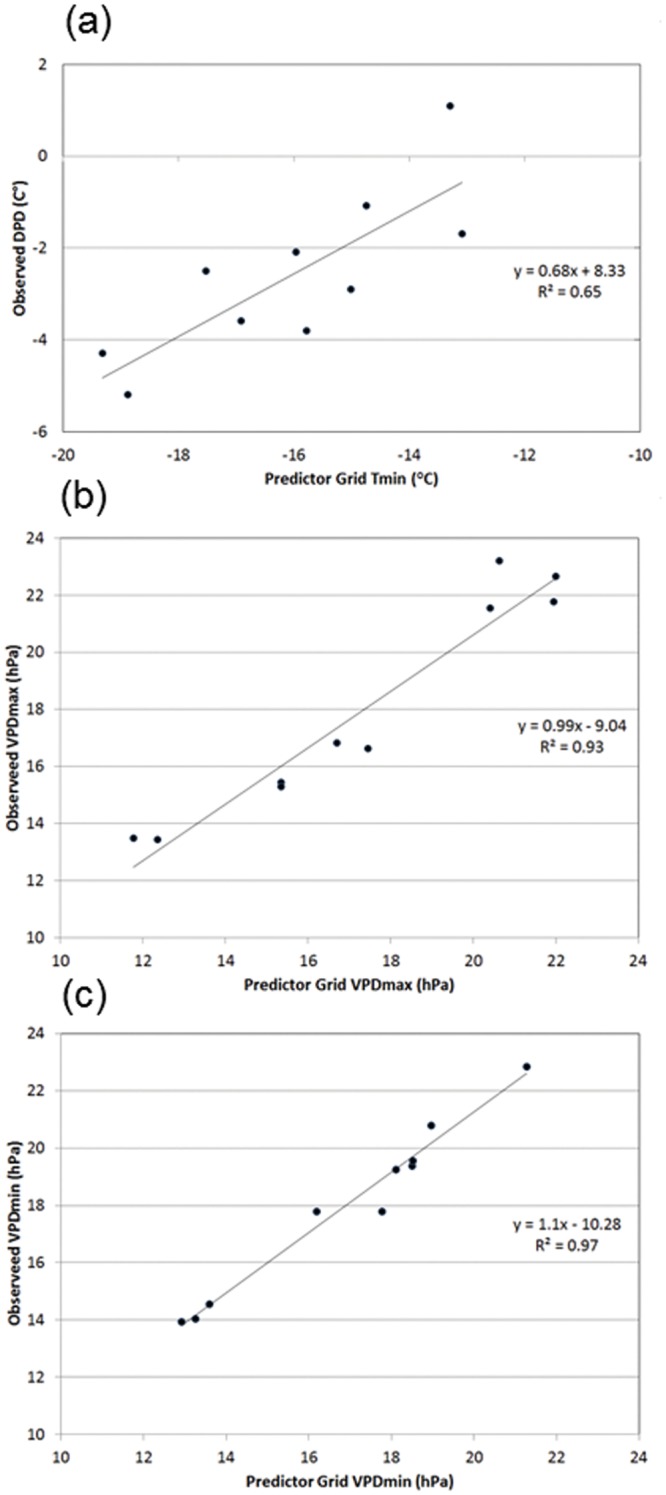
Fig 4. Scatterplots of relationships between predictor grid and interpolated variables.

1981–2010 mean monthly (a) dew point depression (DPD) vs. minimum temperature (T min) for January in western Wyoming; (b) minimum vapor pressure deficit (VPD min) vs. first-guess VPD min for June near Las Vegas; and (c) maximum vapor pressure deficit (VPD max) vs. first-guess VPD max for October in San Francisco.
