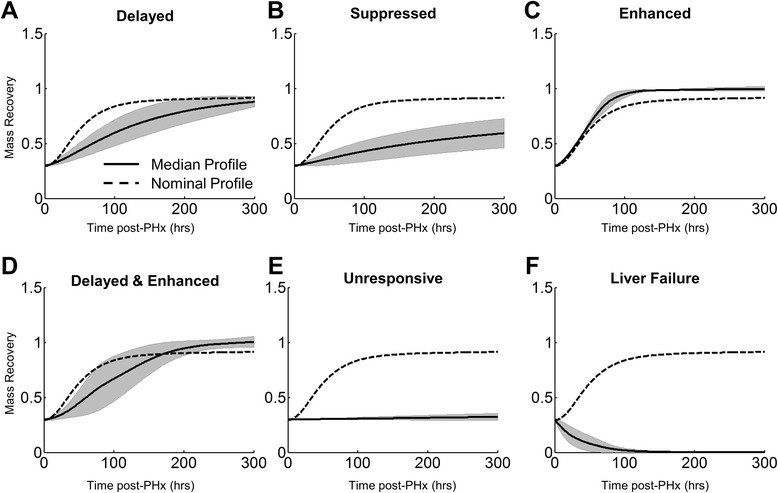
Fig. 3.

Model-predicted modes of regeneration revealed through sampling model parameters (+/− 50 % of nominal values). Varying model parameters simultaneously revealed distinct regeneration modes, including (a) delayed, (b) suppressed, (c) enhanced, (d) delayed and enhanced, (e) unresponsive, and (f) liver failure. The dashed line is the nominal profile; the gray areas indicate +/− 1 standard deviation
