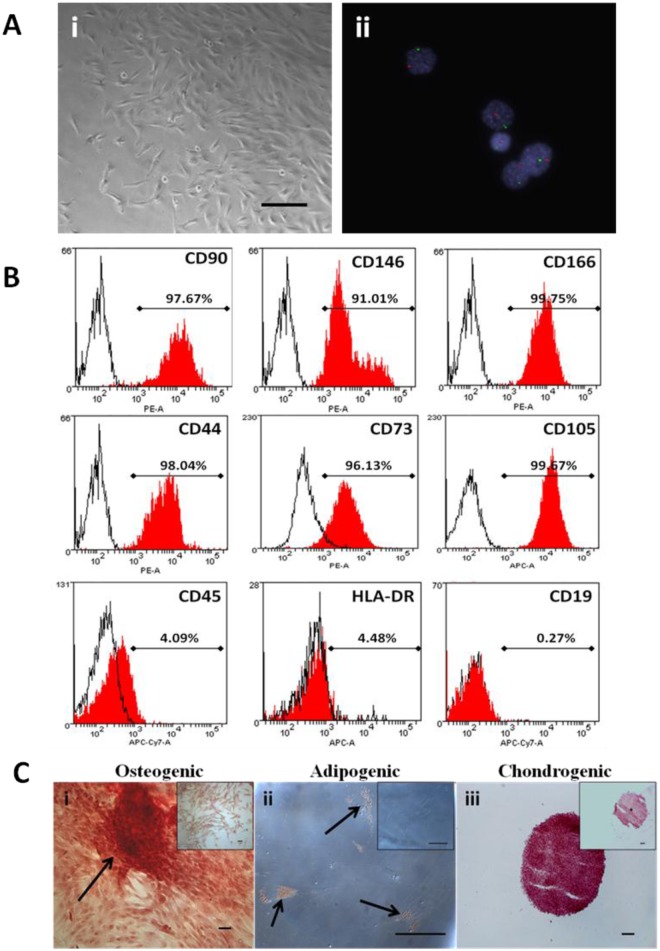
Fig 1. CMSC phenotypic characterization.
A. (i) Bright field microscopy image of CMSCs at P0. Magnification is 100X and scalebar is 100 μm. (ii) CMSCs from placentae of male newborns were analyzed using interphase FISH on MSC nuclei. CMSCs showed one chromosome X (Spectrum Green) and one chromosome Y (Spectrum Orange) signals. Cell nuclei were stained blue with DAPI. Magnification is 630X. B. Primary CMSCs cell surface markers expression. Histograms of representative primary CMSC at P3 depicting the expression of CD90, CD146, CD166, CD44, CD73, CD105, CD45, HLA-DR, and CD19. The red histogram shows the MSC marker antibody staining while the white histogram shows the corresponding isotype control antibody staining. PE: phycoerythrin dye, APC: allophycocyanin dye, APC-Cy7: allophycocyanin-Cy7 dye. C. Representative photomicrographs showing CMSCs differentiation into mesenchymal lineages. (i) Osteogenic differentiation, Alizarin Red staining in cells after 5weeks growth in osteogenic induction medium. Arrows show calcium depositions. (ii) Adipogenic differentiation, Oil Red O staining in cells after 14 days growth in adipogenic induction medium. Arrows show fat droplets. (iii) Chondrogenic differentiation, Safranin O staining for proteoglycans depositions in cells after 21 days growth in chondrogenic induction medium. Inset shows control uninduced CMSCs. Scalebar is 100 μm.

