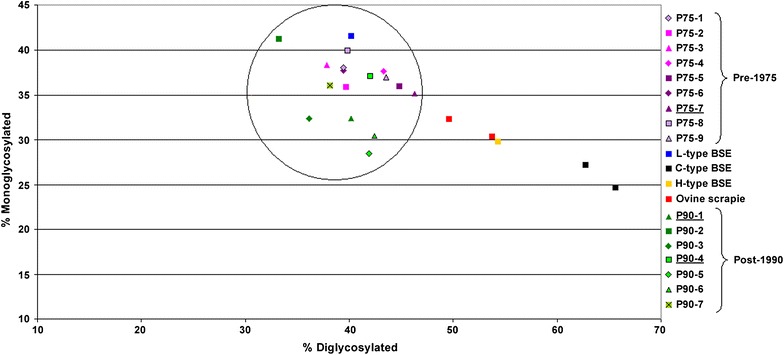
Fig. 3.

Scattergram showing the relative glycosylation quantity analysis of brain material from cattle inoculated with the pre-1975 and post-1990 scrapie pools compared to BSE and ovine scrapie controls. Detection with mAb Sha31. Controls comprised an ovine scrapie case, a classical BSE case (two analyses of the same sample each) and L-type and H-type BSE cases from the UK. The black circle indicates all 16 samples from the intracerebrally inoculated cattle clustering together around the L-type BSE control (blue square). The cases that provided the inocula for bank voles and mice are underlined.
