Fig. 7.

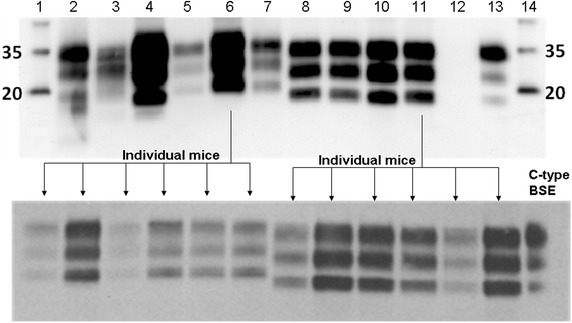
Western immunoblot profiles of tg110 mice inoculated with original scrapie brain pools and bovine scrapie sources P90-1 and P75-7. Lanes on top blot. 1 and 14 Molecular mass marker (kDa). 2 Post-1990 scrapie brain pool. 3 Post-1990 scrapie brain pool in Tg110 mice (first passage). 4 Post-1990 scrapie brain pool in Tg110 mice (second passage). 5 P90-1. 6 P90-1 in Tg110 mice (first passage). 7 Pre-1975 scrapie brain pool. 8 Pre-1975 scrapie brain pool in Tg110 mice (first passage). 9 Pre-1975 scrapie brain pool in Tg110 mice (second passage). 10 P75-7. 11 P75-7 in Tg110 mice (first passage). 12 Negative control (brain from non-inoculated Tg110 mice). 13 Positive control (brain from tg110 mice inoculated with classical BSE: case VLA-PG817/00). Antibody: Sha31. The molecular profile of the original post-1990 scrapie brain pool is maintained after passage in Tg110 mice (lanes 2–4) but does not resemble the profile of P90-1 or the mice inoculated with P90-1 brain (lanes 5, 6). By contrast, the profile of the original pre-1975 brain pool (lane 7) differed from the profile obtained from inoculated Tg110 mice (lanes 8, 9), P75-7 (lane 10) and the mice inoculated with P75-7 brain, which were all similar. The profiles obtained in individual mice after inoculation with the steers’ brains were identical within each inoculation group (bottom blot).
