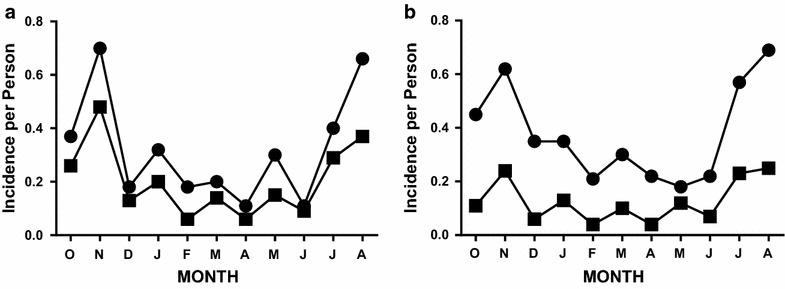
Fig. 2.

Incidence of P. falciparum infection. a Slide-negative subjects. Data compare slide-based estimates of incidence (filled squares) with molecular estimates of incidence (filled circles) for the subset of subjects who were slide-negative at the beginning of each monthly observation period. b All subjects in the cohort. Data compare slide-based estimates of incidence (filled squares) with molecular estimates of incidence (filled circles) for all subjects in the cohort
