
Fig. 5.
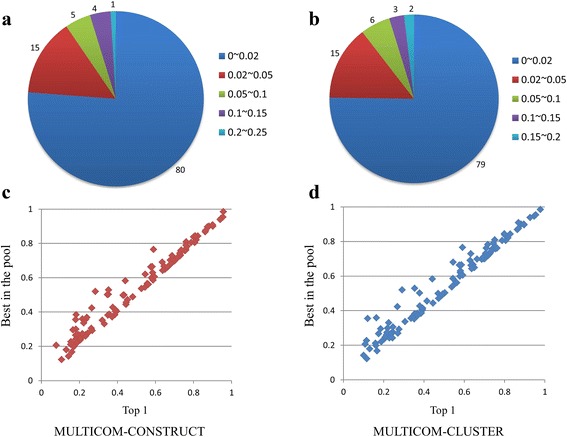
Evaluation of the ranking strategy. a and b illustrate the number of domains in various ranges of differences in GDT-TS scores between best of top 5 models and top 1 models generated by MULTICOM-CONSTRUCT and MULTICOM-CLUSTER respectively on 105 CASP11 domains. c and d show scatter plots of GDT-TS scores between top 1 models and the best models in the model pool for the two servers separately