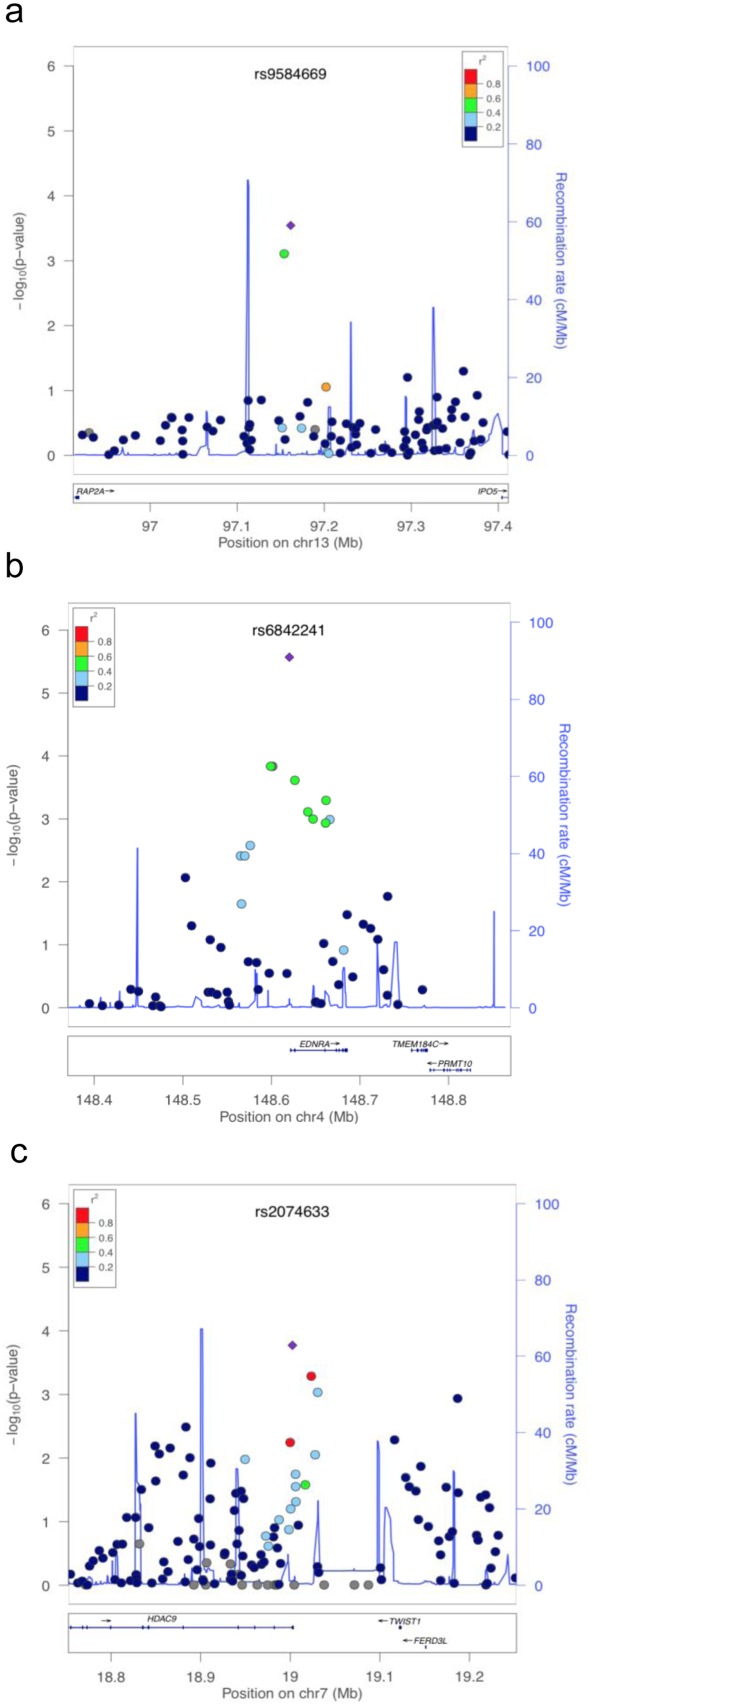
Fig 2. Regional plots of susceptible loci on 13q32.2 (a), 4q31.2 (b), and 7p21.1 (c).
Estimated LD structure of the genomic region in the JPT HapMap samples is shown as light-blue lines, and the genomic locations of genes within the regions of interest were annotated using the UCSC Genome Browser and are shown as arrows. SNPs are colored according to their LD with the tag SNP. Diamonds in red represent the most significantly associated SNP in each region in the GWAS.

