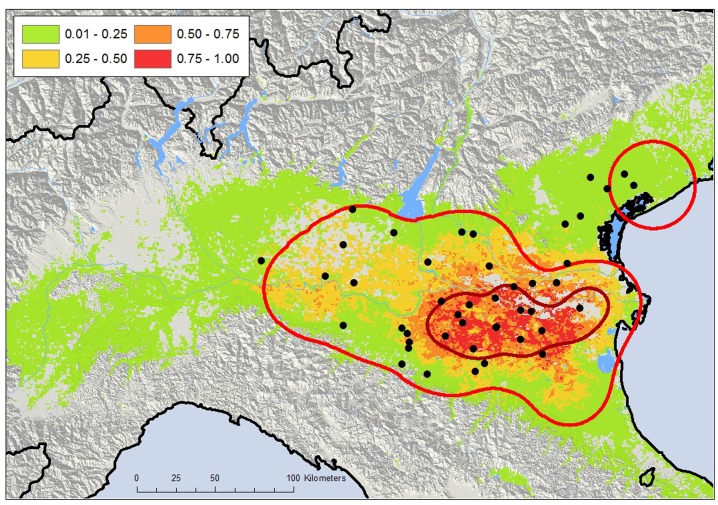
Fig 3. Nonlinear discriminant analysis (NLDA) and human cases of West Nile neuroinvasive disease (WNND).
Localization of WNND cases (black dots) and NLDA analysis showing the modeled distribution probability of WNV circulation (see legend for probability) in northern Italy according to the results from 78 surveyed stations. The red lines represent the 95% and 50% volume contour of the WNV-circulation area estimated by kernel density estimation (KDE).

