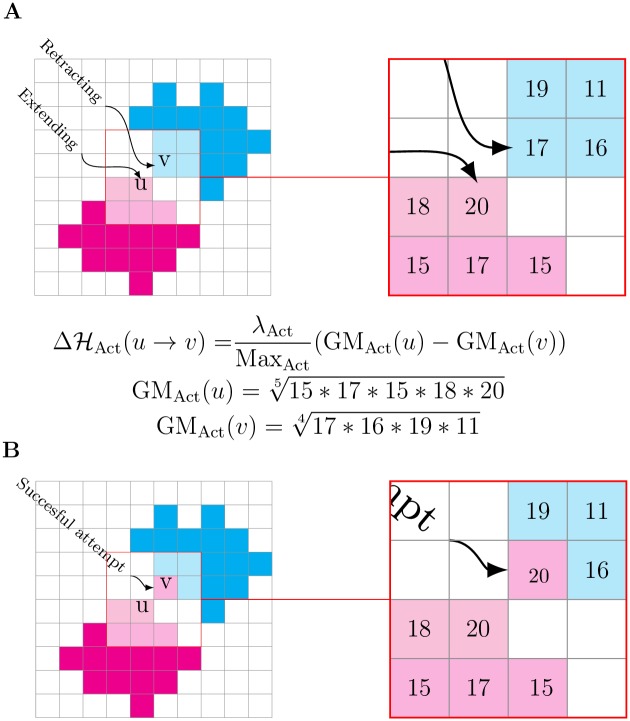
Fig 1. Example of a CPM copy attempt with the Act model.
In the Act model, we encourage copying from sites with relatively high activity values to sites with lower values. (A) The magenta cell is attempting to copy itself into the cyan cell by extending from lattice site u into the lattice site v. The right inset magnifies the intracellular neighborhoods of u (light magenta) and v (light cyan); the lattice sites contain examples of activity values. We obtain GMAct(u) and GMAct(v) by geometrically averaging over the activity values of each neighborhood, and we calculate from the difference of these values. The success probability of the copy attempt is biased by subtracting from . In this example (i.e., MaxAct = 20, λ Act > 0), which increases the chance of accepting the copy attempt. (B) If the copy attempt is successful, v is incorporated into the magenta cell and the site is assigned the maximum activity value (in this case, MaxAct = 20).

