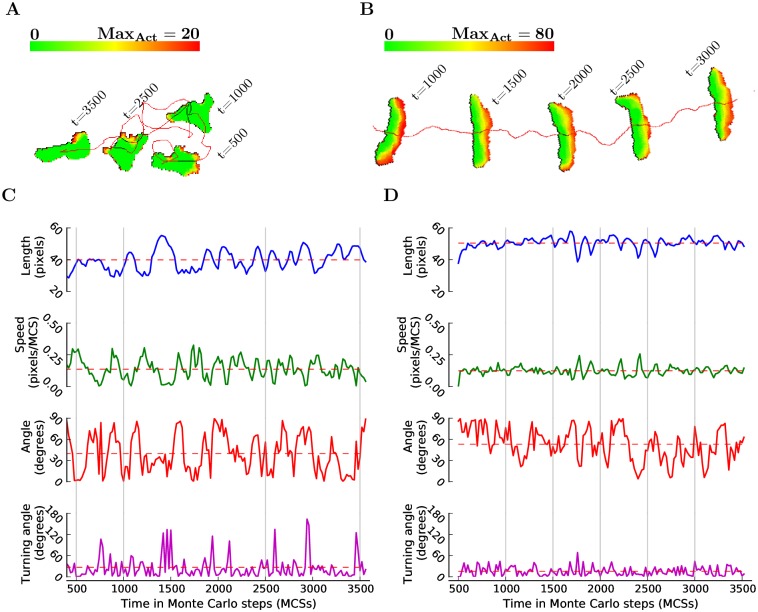
Fig 3. The Act model reproduces amoeboid and keratocyte-like behavior.
(A) Typical appearance and migration behavior of an amoeboid cell; cell track in red. (B) Typical appearance and migration behavior of a keratocyte-like cell. The colorbars represent the activity values scaled from 0 (green) to MaxAct (red). (C) Traces of the instantaneous migration features corresponding to the amoeboid cell in (A). (D) Traces of the instantaneous migration features corresponding to the keratocyte-like cell in (B). Vertical gray lines highlight the time points at which the cell snapshots were taken. Red dashed lines show the average values of the migration features calculated over the whole track. See Methods section for definitions of measurements and for the complete list of parameter values.

