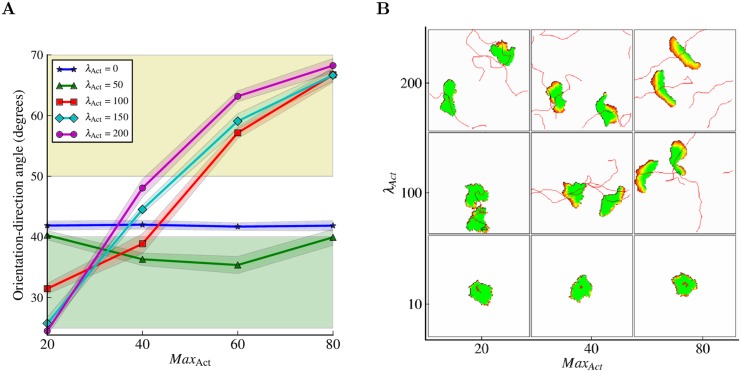
Fig 4. Amoeboid to keratocyte-like transition.
(A) Low orientation-migration angles are typical for amoeboid cells (green region); high ones indicate transversal migration which is typical for the keratocyte-like cells (yellow region). For large enough λ Act, there is a transition between amoeboid behavior at low MaxAct values and keratocyte-like behavior at high MaxAct values. λ Act amplifies the amoeboid or keratocyte-like behavior, but cannot trigger a switch from one type of behavior to another on its own (e.g., no λ Act value combined with a low MaxAct will result in keratocyte-like behavior). Every point in the graph represents the mean of 10 experiments of 30.000 MCSs each with sampling time Δt = 20 MCSs between consecutive measurements. The shadows represent the standard deviations. (B) Morphospace of the Act model illustrating cell behavior at different combinations of parameter values. Every cell is showed at two positions along its track, except for the non-migrating cells. At λ Act = 10 the cells are roundish and stationary: very similar to the basic CPM cells. At high λ Act values and low MaxAct values the cells are amoeboid; at high λ Act values and high MaxAct values the cells are keratocyte-like (see also S2 Video). See Methods section for definitions of measurements and for the complete list of parameter values.

