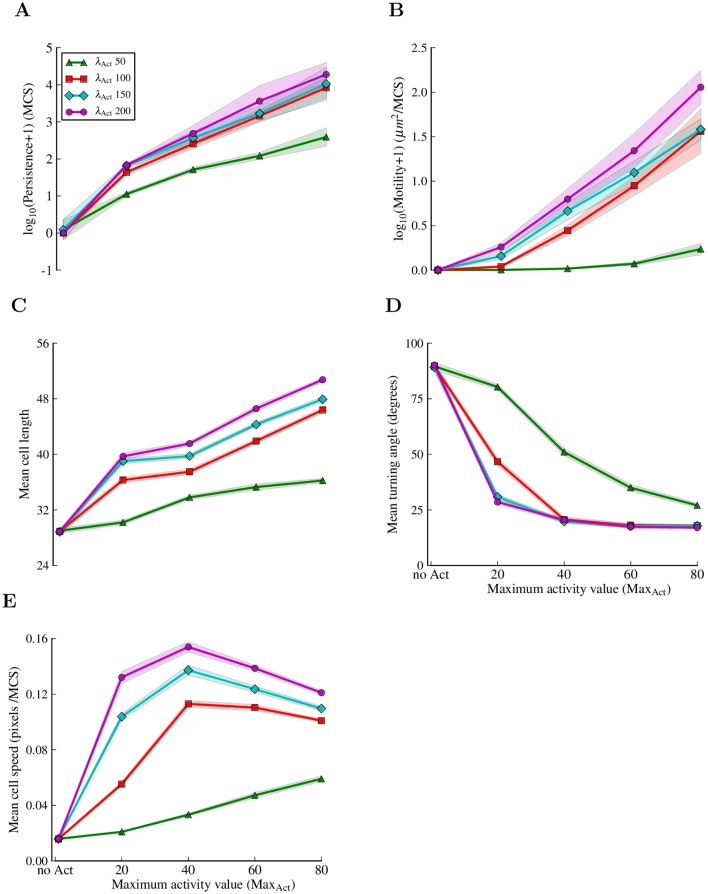
Fig 5. Migration features of cells in the Act model.
Increasing the MaxAct and λ Act parameters makes cells (A) more persistent, (B) more motile, and (C) longer. (D) The average turning angle of the cells decreases with both MaxAct and λ Act from the random 90 degrees (typical for the jiggling of the basic CPM cells) to average values as low as 20 degrees as the cells migrate more organized. (E) The instantaneous speed of cells initially increases with MaxAct and λ Act, then decreases. The first point on the x axis represents the original CPM setting, without the Act model, i.e λ Act = 0, MaxAct = undefined. The migration features were extracted from single cell experiments. Every point in a graph represents the mean of 10 simulations of 30.000 MCSs each with sampling time Δt = 20 MCSs between consecutive measurements. The shadows represent the standard deviation. See Methods section for definitions of measurements and for the complete list of parameter values.

