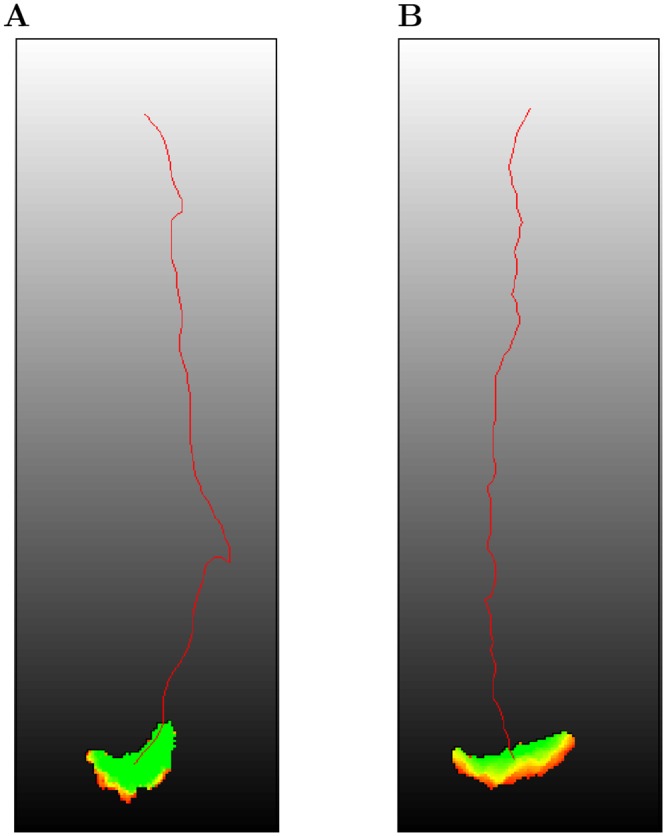
Fig 6. Amoeboid and keratocyte chemotaxis.

(A) Amoeboid cells (λ Act = 200, MaxAct = 20) and (B) keratocyte-like cells (λ Act = 200, MaxAct = 80) were placed in linear chemokine gradients (slope 0.33, λ Chemotaxis = 150) along the y axis (white to black gradient). Cell tracks are colored in red. See also the corresponding movies S5 and S6 Videos.
