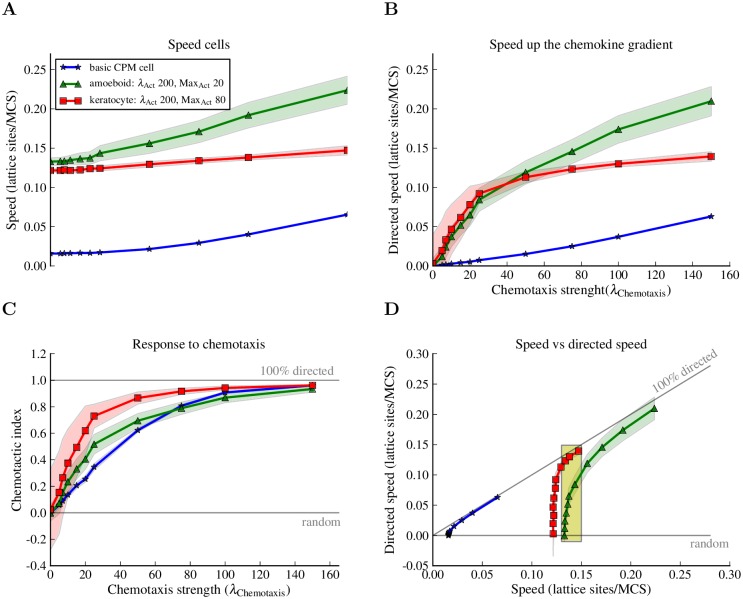
Fig 8. The Act model makes cells more sensitive to chemotaxis.
Basic CPM cells (λ Act = 0), amoeboid cells (λ Act = 200, MaxAct = 20) and keratocyte-like cells (λ Act = 200, MaxAct = 80) were placed in chemotactic gradients. The average instantaneous speed and the average directed speed were measured for different values of the chemotaxis strength parameter (λ Chemotaxis). Every point in a graph is the average of 300 single cell simulations of 5000 MCSs each with sampling time Δt = 20 MCSs between consecutive measurements. The blue, red and green shadows represent the standard deviations. (A) The speed of cells increases with increasing λ Chemotaxis values; the speed of the amoeboid cell grows much faster than that of the keratocyte-like cells. (B) The speed up the chemokine gradient is growing with λ Chemotaxis. (C) The Act model makes keratocyte-like and amoeboid cells more sensitive to the chemokine gradient; they migrate more directionally than the basic CPM cells at low values of λ Chemotaxis. (D) The directed speed of the keratocyte is higher when cells have the same speed (yellow highlighted region). See Methods section for definitions of measurements and for the complete list of parameter values.

