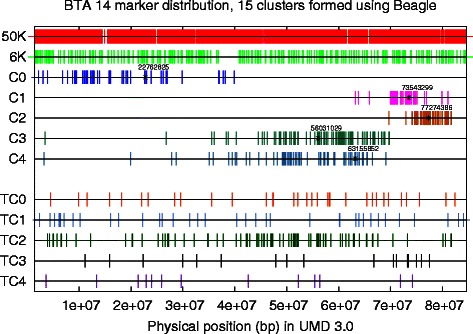
Fig. 2.

Untyped SNP genotype piecemeal imputation. Both the SNP set T of a lower density 6 K chip and the SNP set T∪U of a higher density 50 K chip are shown, using their physical loci on BTA 14. The second to the seventh lines plot the SNPs in the first five clusters, by the k-means algorithm (k=15) on the marker feature vectors generated by the add-one two-step imputation using Beagle. The starred markers are the selected markers, one per cluster, and the associated target marker clusters are shown in the last five lines in the figure
