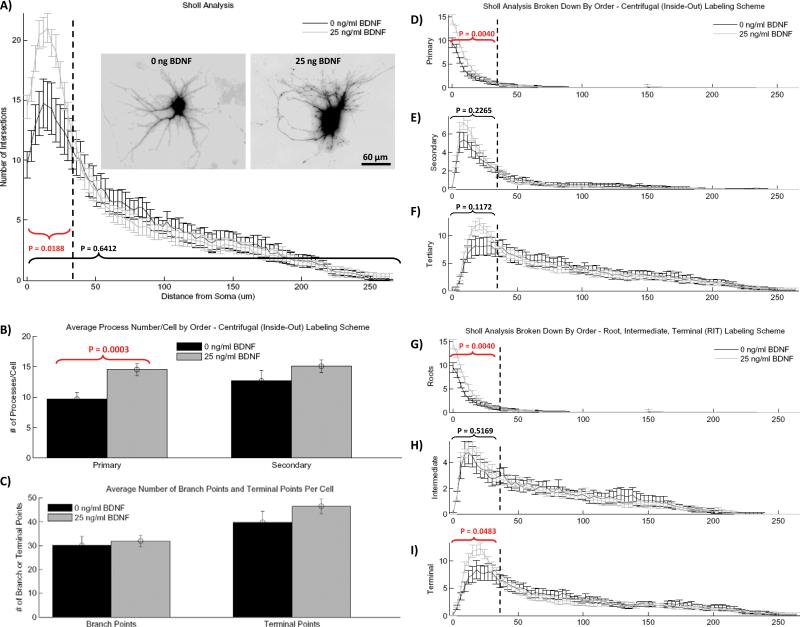
Figure 4.
Results of the Bonfire analysis for hippocampal neurons treated with 25 ng/ml BDNF and untreated control neurons. A) Total Sholl curves with example inverted GFP images (inset). B) Average number of primary and secondary processes per cell. C) Average number of branch points and terminal points per cell. DF) Segment identity-specific Sholl analysis according to the I/O labeling scheme, where segments have been grouped as either primary (D), secondary (E) or tertiary and greater (F). GI) Segment identity-specific Sholl analysis according to RIT labeling scheme, where segments have been grouped as either root segments (G), intermediate segments (H), or terminal segments (I). All error bars represent the standard error of the mean (SEM). Statistical analysis of dendrite number was performed on the total number of Sholl intersections in the bracketed regions using two-tailed unpaired t test with Welch correction (n = 18 for 0 ng/ml BDNF condition, n = 24 for 25 ng/ml condition). [Color figure can be viewed in the online issue which is available at wileyonlinelibrary.com.]

