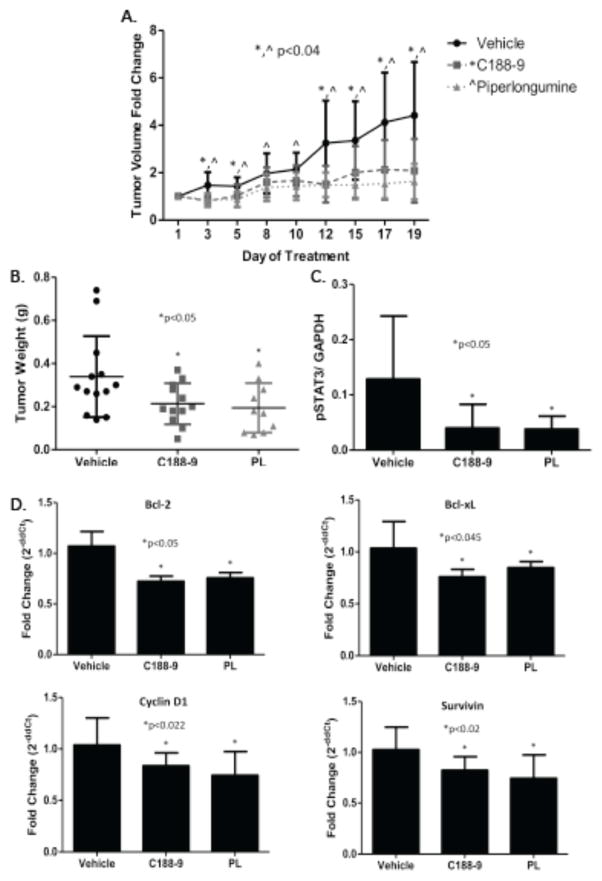
Figure 5. Effect of C188-9 and PL on A549 xenograft tumor volume, tumor weight, pSTAT3 levels, and expression of downstream STAT3 gene targets.
Tumor volumes (A) or weights (B) were measured on the days indicated or following treatment for 3 weeks, respectively, with C188-9 (50mg/kg IP twice daily; n=12), PL (30mg/kg IP daily; n=11), or vehicle (n=17). The mean ± SD for each group is shown. In panel A, asterisk (*) or caret (^) indicates a reduction compared to vehicle in animals treated with C188-9 (p<0.04) or with PL (p<0.04), respectively. In panel B, the asterisk (*) indicates p<0.05. C) Levels of pSTAT3 and GAPDH levels were determined using Luminex beads in protein extracts of tumors; pSTAT3 levels were normalized for GAPDH and the mean ± SD shown; the asterisk (*) indicates a reduction in pSTAT3 levels in C188-9- or PL-treated tumors compared to vehicle (p<0.039). D) Levels of STAT3 downstream genes targets were assessed by RT-PCR in total tumor RNA. Mean ± SD is shown; an asterisk (*) indicates a significant reduction in Bcl-2 (p<0.05), Bcl-xL (p<0.045), Cyclin D1 (p<0.022) and Survivin (p<0.02) RNA levels in C188-9- and PL-treated tumors compared to vehicle-treated tumors.

