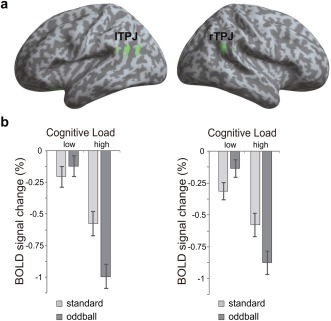
Figure 4.

Interaction between top‐down and bottom‐up processes. (a) Regions identified by interaction contrast ([oddball − standard]high − [oddball − standard]low). Deactivation was seen bilaterally in the region of the TPJ. (b) BOLD signal change (% in beta value) extracted from bilateral TPJ clusters in each condition. Error bars: ±SEM.
