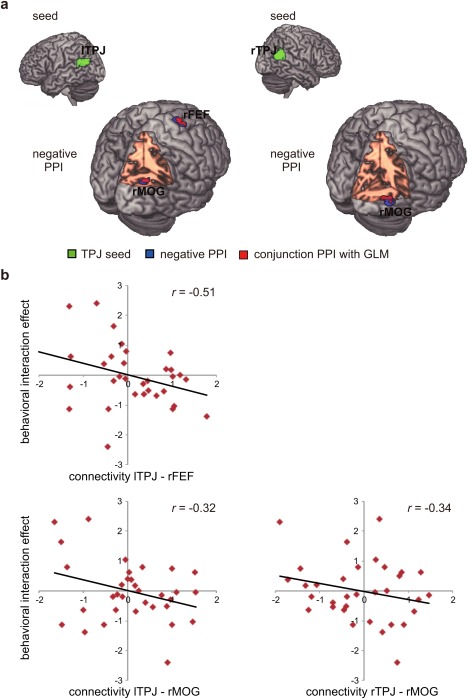
Figure 5.

PPI and ROI results. (a) PPI results. Top row: seed regions of left and right TPJ for PPI analysis. Bottom row: regions showed negative associations with left or right TPJ modulated by the interaction between experimental manipulations. Decreased activity in the left TPJ was associated with increased activity in the rFEF and rMOG, while decreased activity in the right TPJ was associated with increased activity only in the rMOG. Green color indicates the seed regions of the bilateral TPJ. Blue color indicates regions showing negative PPIs with the TPJ. Red color indicates conjunction regions of bottom‐up contrast image of the GLM (oddball > standard) and the PPI image, and the conjunction of top‐down (high cognitive load − low cognitive load) contrast image and the PPI. (b) ROI and correlation results. The PPI between the lTPJ and rFEF was negatively correlated with behavioral interaction effect. The PPI between the bilateral TPJ and rMOG was marginally correlated with behavioral interaction effect.
