
Figure 6.
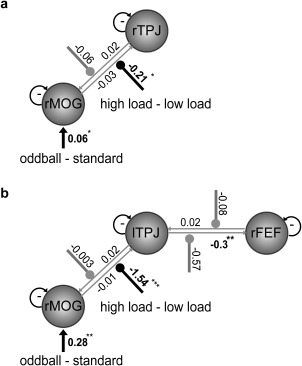
DCM models and results. (a) DCM model of the rTPJ and rMOG. (b) DCM model of the lTPJ, rMOG, and rFEF. Bold arrows indicate the driving input (oddball − standard). Arrows with circle in the end indicate the modulatory effect (high load − low load), with significant modulation in black and nonsignificant modulation in gray. Significant parameters are indicated by the asterisk (* P < 0.05; ** P < 0.01; *** P < 0.001).