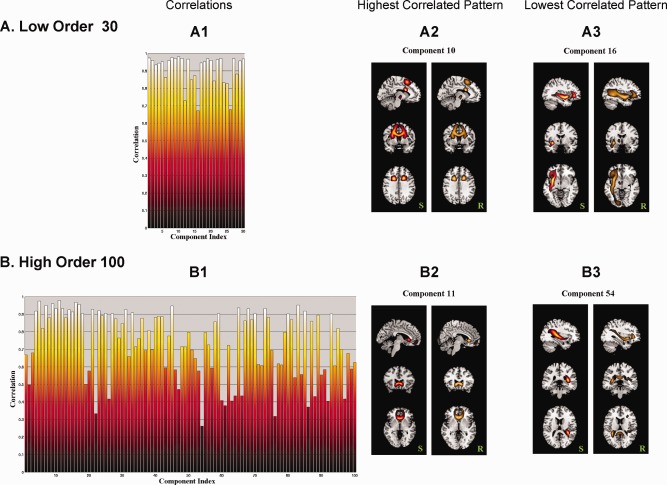
Figure 8.

The spatial correlation between rows of S and the corresponding columns of R for the low model order analysis (A) are compared to those of the high model order analysis (B). A1 and B1 are the correlations between all S and R pairs for the two model orders, A2 and B2 are the tract patterns of the pairs with the highest correlation, and A3 and B3 are the tract patterns of the pairs with the lowest correlation between S and R pairs. The S part of component 16 (A3) is connected to a broader region in R, lowering the correlation; whereas the S part of component 54 (B3) is connected to regions in the opposite hemisphere, lowering the correlation. [Color figure can be viewed in the online issue, which is available at http://wileyonlinelibrary.com.]
