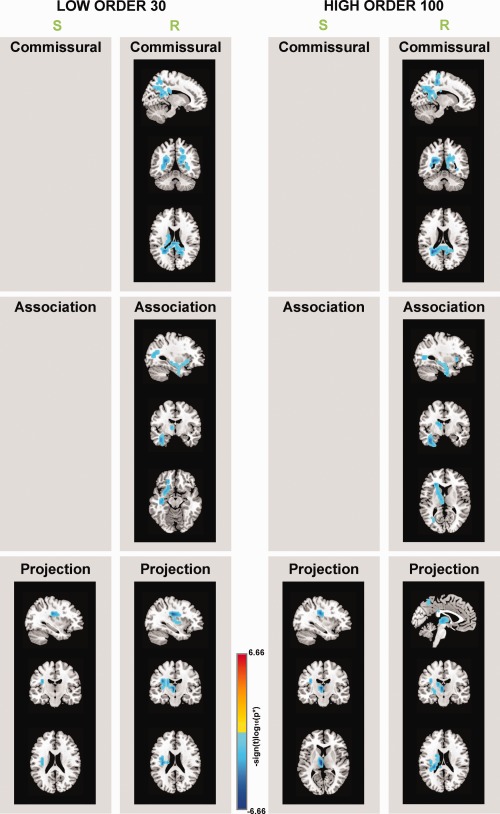
Figure 9.

The regions with significant group differences (P < 0.05*) between patients with schizophrenia and healthy controls are separately illustrated for the low and the high order models, and for S and R. The effect of age was removed, the significance was after FDR correction and significant clusters larger than five voxels are shown. The blank areas mean that there were no significant differences found in these categories. [Color figure can be viewed in the online issue, which is available at http://wileyonlinelibrary.com.]
