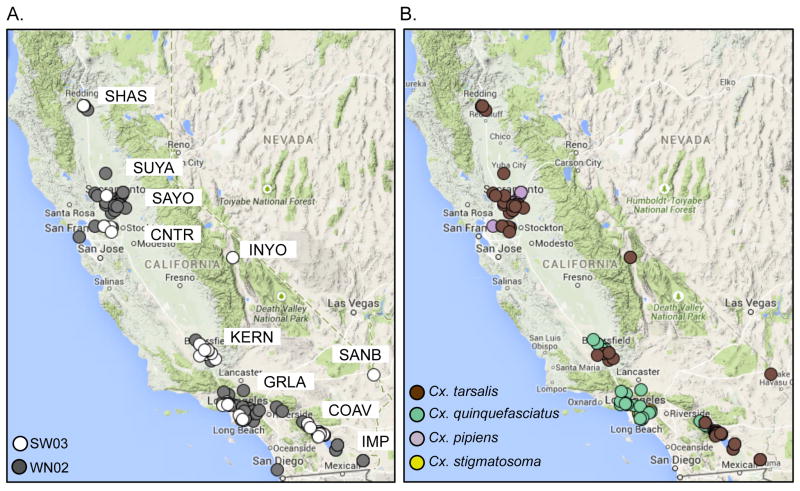
Figure 2.
Spatial distribution of WNV isolates sequenced in this study. (A) A map showing the location of WN02 (filled circles) and SW03 (open circles) isolates sampled in this study, with locations of mosquito control districts indicated. (B) A map showing the location of isolates sampled in this study stratified by mosquito species.

