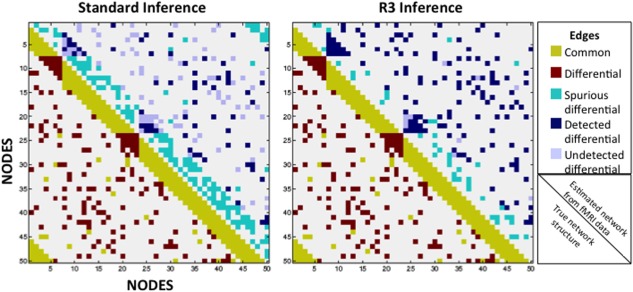
Figure 1.

The R3 approach detects fewer spurious differences and more true edge differences, while also controlling the false discovery rate more effectively than standard inference tests (two‐sample Wald tests with FDR adjustments for multiple testing). Two artificial networks of 50 nodes and 510 edges were constructed, with 360 edges common to both graphs, and only 150 edges existing exclusively in one graph. Using standard inference tests and the novel R3 approach, we compared each technique's ability to uncover the latent graph structure beneath simulated functional MRI data from two groups of 20 subjects. Upper halves represent inference results, detailing common edges that were incorrectly identified as differential between groups (turquoise; false positives), differential edges that were correctly identified as differential (navy; true positives), and differential edges that went undetected (lilac; false negatives). [Color figure can be viewed in the online issue, which is available at http://wileyonlinelibrary.com.]
