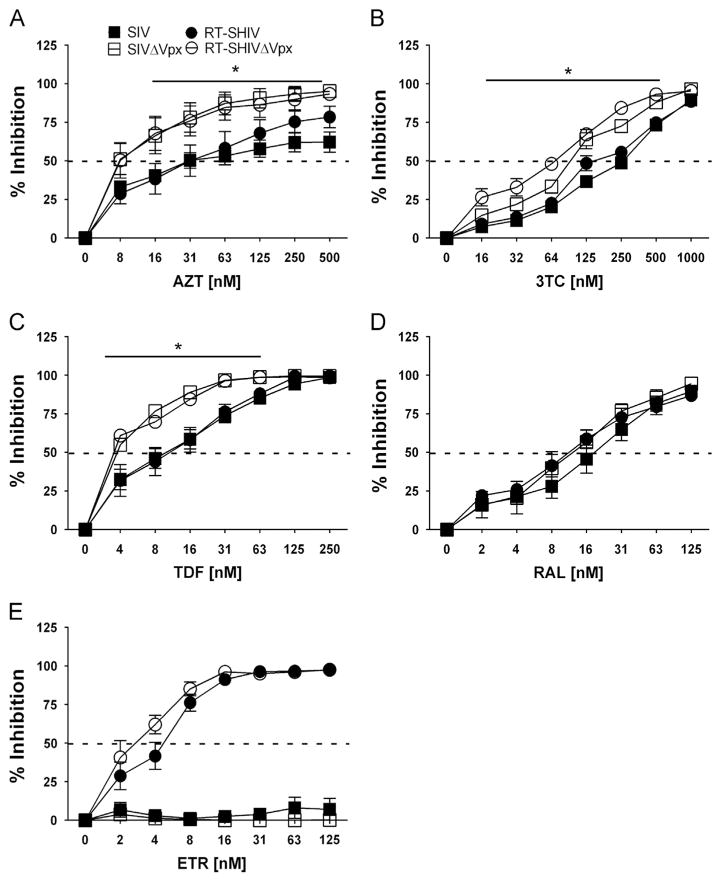
Fig. 2.
Dose–response of NRTIs in activated CD4+ T cells challenged with molecular clones that code, or do not code, for Vpx. Percent inhibition (y-axis) of CD4+ T cells treated with increasing concentrations (x-axis) of AZT (A), 3TC (B), TDF (C), RAL (D) and ETR (E) before challenge with SIV (filled squares), SIVΔVpx (open squares), RT-SHIV (filled circles) and RT-SHIVΔVpx (open circles). Dashed line transects curve to show where 50% inhibition occurs. Significant differences in dose–response curves are indicated with an asterisk (*). Data points depict the means and standard error of the means from three to four independent experiments.

