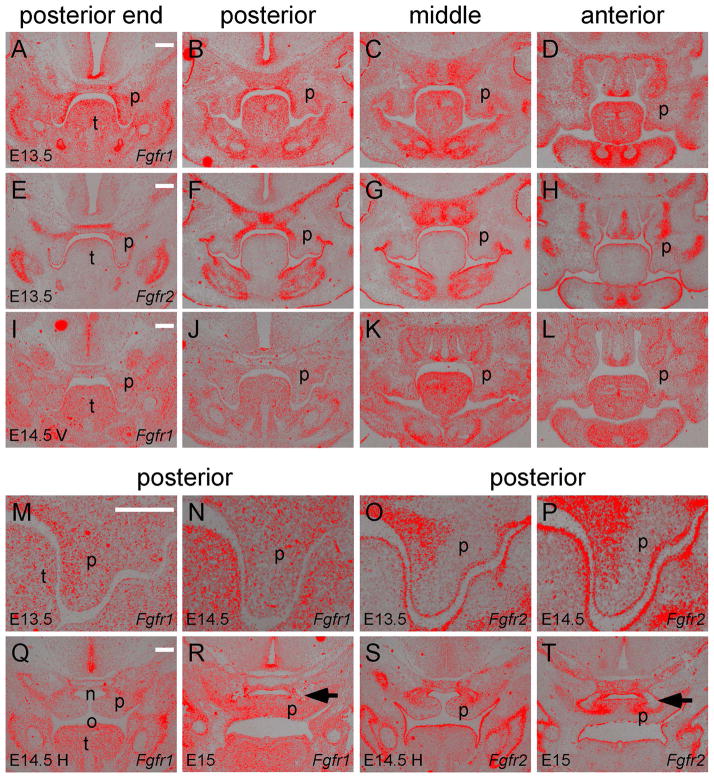
Figure 1.
Fgfr1 and Fgfr2 expression in different regions along the anterior-posterior axis of the secondary palate. (A–D) Fgfr1 expression and (E–H) Fgfr2 expression detected by in situ hybridization (red) on coronal sections of the posterior end, posterior, middle and anterior regions of an E13.5 palate. (I–L) Fgfr1 expression in an E14.5 palate before elevation (V, vertical shelves). Noted that Fgfr2 expression at E14.5 before elevation was shown in a previous study (Snyder-Warwick et al., 2010). (M and N) Magnified images comparing Fgfr1 and Fgfr2 expression in the palatal epithelium and mesenchyme of the posterior region at E13.5. (O and P) Magnified images comparing Fgfr1 and Fgfr2 expression in the palatal epithelium and mesenchyme of the posterior region at E14.5 before elevation. (Q) Fgfr1 expression in the posterior region of an E14.5 palate after elevation (H, horizontal shelves). (R) Fgfr1 expression in the posterior region of an E15 palate after fusion of the palatal shelves. (S) Fgfr2 expression in the posterior region of an E14.5 palate after elevation. (T) Fgfr2 expression in the posterior region of an E15 palate after fusion of the palatal shelves. Arrows in R and T indicate mesenchymal condensation of the palatine bones. n, nasal cavity; o, oral cavity; p, palatal shelf; t, tongue. Scale bars, 200μm.

